CHAPTER 17
Nomesh Bolia, Sri Harsha Dorapudi and Shaurya Shriyam
“Real leaders focus resources in areas that provide the greatest opportunity rather than making across-the-board decisions.”
◆ The court performance, measured in terms of numbers related to the speed of decision-making making does vary with different categories and attri- butes of the cases;
◆ Indications that reallocation of judicial resources can aid in improving system performance;
◆ More detailed studies need to be conducted before this becomes imple- mentable, but the promise of Operations Research-based Optimisation shows up.
India’s court system is one of the most congested in the world, with more than 59 million cases pending. The constitutional framework is responsible for uphold- ing the rule of law and ensuring justice for all citizens. It has a three-tier system consisting of the lower, higher, and the Supreme Court of India. These courts at the individual level facilitate the public with timely justice through judgments at the earliest. The delays in the disposal of the cases and necessary measures are observed to be based on many factors 1 . The factors resulting in the pendency need to be identified and analysed to identify necessary changes to improve the justice system. Overall, judicial inefficiencies come from various sources and one of the major ones is pending court cases.
Accordingly, this chapter deals with the issue of pendency and utilises methods from the broad discipline of Operations Research to do a systemic analysis based on data available in the public domain. As seen in the next section, the amount of data on Indian courts made available publicly is huge and can be used for a variety of analyses. Clearly, a mere chapter in a volume can’t do justice to all the possibilities, but it does provide a glimpse of what is possible. Much more can be done, as described in the rest of the volume in general, and the previous chapter in particular.
The outline of this chapter is as follows: the rest of this section simply high- lights the numbers, including that of population and cases. The idea is to set the context and underline that while the pendency woes are big, they have not arisen in a vacuum. There is a context of the scale of the entire country to it. Section 2 discusses the data sets available in the public domain. It includes details of what is available. Figures depicting the information available, and an overview of the extent and scale of the datasets are provided. One of the key points of this chapter is that while pendency is a major issue for the judicial system, the situation is not the same across various categories. The situation is different from geography to geography. So, for example, it varies from state to state, and within a state too, there are examples of significant variation between districts. Likewise, the situation is not uniform with respect to the types of litigants. There are clear dif- ferences, and understanding them properly to yield insights for the system overall can be an important step in tackling the challenge.
This diversity is good news. It tells that while some categories are facing a chal- lenge, others are not. Highlighting either that some categories are simply facing a higher load due to factors whose origins are exogenous to the judiciary, or possibly due to some unanalysed aspects of the judicial process itself. If former, through the data analysis performed, insights can be drawn on what are the categories that have an inordinately greater onslaught and recommendations made to address them. Particularly, in as much as the factors directly or indirectly intersect with the judicial system after their origins outside of this system. However, if some interventions can be identified that are within the purview of the judicial process itself, those are worth giving serious consideration. Particularly more so, since the diversity implies there are some categories (geographies such as districts or states, or otherwise) within the same overall system that are probably doing some components of the overall process better. This means that peer learning itself can provide interesting ideas and resolutions.
It is to be emphasised here that such peer learning is even more likely when it occurs within the entities (courts) of the same sovereign state, i.e., India will hold the argument. As a result, it can independently find more acceptance among various stakeholders or key decision-makers who can use this point to force the implementation of the insights and interventions they deem essential. The peer learning activities lay the foundation for strengthening the law as well as facil- itating to building of trust in judiciaries by securing justice. It also creates an opportunity to explore the challenges for these peer learning exchanges to create a fair and effective judiciary. Irrespective of the result and the impact through measurement, the approach of peer learning will benefit the judicial system in the long term 2 . Initially, the practices can be implemented in a single court where the possibilities of planning, monitoring, and facilitating can be analysed. Further, the details of peer learning can be extended to multiple courts, i.e., two or more systems to understand and validate the information on a larger scale.
To further highlight this through data, sections 3 and 4 perform an analysis of the various categories, viz., geographical (state/district wise) and litigant type respectively. The judiciary can use the analysis to draw valuable insights. To the best of our knowledge, this is the first such analysis done for the judicial system of India, putting to good use the data that the key stakeholders have been visionary enough to put in the public domain. Needless to say, much more can be done if more data is made available in a usable format.
This diversity also points to one more dimension that can be used to intervene for reduced pendency: balancing of loads across courts. Balancing load among various resources is an all-pervasive mechanism to improve efficiency across all sectors of the economy. The same basic principle can also be used for the judiciary, not as a final solution, since that will involve a much detailed analysis that only be conducted by the judiciary. Not only is data to move further not available to external stakeholders such as educational institutions and the private sector, but they also lack the wide-based understanding and the wisdom that comes with it to contextualise the outcomes of Operations Research methods. Nevertheless, an OR-based analysis can provide pointers to possibilities that can be explored fur- ther with the cooperation and involvement of key judicial stakeholders. Section 5 performs such an analysis for the reallocation of cases among judges to reduce their disposal times. The findings presented here, again, are the first time such results have been obtained for the Indian judiciary, to the best of our knowledge. As we reiterate later, the claim is not that the recommendations coming from these results are ready to implement or definitely going to work as it is, but simply that this is a direction that all relevant stakeholders can consider, after all due modifications, upgrades, crosschecks and stakeholder consultation. Finally, this is all ongoing work, and so there clearly are lots of directions for future work. Section 6 concludes the chapter with some overall concluding remarks and an agenda for the pursuit of such future work.
We begin with outlining the context with some data. A huge gap is observed between the judge, and the population contrasted with the other countries. Currently, in India, the ratio is 21 judges per million of the population, which is less when compared to the US, where it is 100 judges. The Indian judiciary is facing an increase in cases being adjudicated and numerous vacancies at all levels 3 . This states that the judicial burden of courts has increased, and many jurisdictions are short of judges. The Supreme Court of India, the apex court of India, has approximately 68847 cases as of 01.04.2023, covering 49823 of the admission and 19024 regular hearing matters 4 . Independence and fairness in adjudication are the dimensions focused on the economic point as well as the proper functioning of the courts. So, the timely resolution of the cases will help in not suffering from huge costs that undermine the spirit of the judiciary 5 . The revenue loss associated with fixed or specific court fees from the appeals and filing delays results in the longer trial length of the cases and, in turn, results in dismiss- als or disposal delays. The time spent on an individual case and the cost associated with the resources utilised for filing, pleas, and judgment enforcement for various proceedings are summed to understand the economic effect. The mobilisation of resources and wealth, the rate of growth, and economic quality are all significantly influenced by sociopolitical issues. It is crucial to view social justice as a quadratic equation of economic growth. Understanding the monetary value of justice as a parameter, the United States is one-fifth of the GDP 6 . So, in comparison with the developed countries in terms of economic stability and monetary value, India, as a developing nation, needs to focus on the gaps in delivering social justice. The development process will be detoured if social justice imbalances constrain developing countries. 7 There is a necessity for providing directions to the judges of a court through which the delay times can be brought down, and it can change the course of the trial 8 .
Table 1 adds the time dimension to this story and shows that the pendency in
the courts at various levels of the hierarchy is increasing 9 .
As discussed earlier, the pendency picture is not the same everywhere and for all categories. Depending on attributes such as district/state, litigant type, and case type, there is a difference in the effect of pendency. Next, we consider this in more detail in the subsequent sections.
Table 1: Details of the pendency cases 10
|
Between 2010-2020 |
Pendency of cases grew annually by 2.8 per cent |
|
Between 2019-2020 Pendency increased by 20 per cent in high courts and |
13 per cent in subordinate courts. |
The judicial system is privy to enormous amounts of data that can be processed and used for a thorough analysis of pendency across various categorisations as we will see below. The 2 phases of ecourts have enabled case-level data to be publicly available on the ecourts website as summarised in figure 1.
The individual judgments for different cases and from various states and dis- tricts have much to consider during the analysis. As seen in Figure 1, the data from individual cases refers to a case in the Ananthapur district court. It has details on the filing as well as the registration date and number and the case type as identified by the court. It also has details on the hearings, including the dates of the hearings so far and the next hearing of the case, as well as the current stage of the case, which in Figure 1 is indicated as “SUMMONS”.
It also mentions the litigants, including the petitioner(s) and the respondent(s) as also the act relevant to the case. Finally, it also mentions the relevant judge, understandably not by name but by designation. This is an instance of a case that is not disposed of yet. Figure 2 provides information for cases that are already disposed of, it includes the details of all hearings and the status of the case. Thus, it really is a comprehensive summary of the case through its lifecycle in the court:
i) jurisdiction,
ii) registration followed by hearings through various stages leading to eventual disposal where relevant,
iii) details of all stakeholders including the litigants and the attributes assigned to them by the judicial system such as its case type, relevant act and more.
Thus, the objective of this chapter is to analyse the diversity of cases in terms of their i) litigant category and ii) geography/jurisdiction that can be served through this dataset. The other kinds of data available in similar public domain resources can also enable the development of optimisation models discussed in this chapter.
However, the ecourts website has all this data in the form of HTML pages. The fields corresponding to the detailed information alluded to earlier in the section need to be extracted and stored in a form ready for analysis. Data Science and Operations Research tools such as Python and SQL are used for the extraction and storage of this information. These steps ensured the readiness of the data for the subsequent analysis of Sections 3, 4 and 5.
While performing this exercise of data collection, we also realised certain issues with the way data is being collected. This has led to some insights for the data collection process and database template design on making the data more usable by both researchers and practitioners such as lawyers and judges. The insights are:
a. Case label section: The backend database should have checks enabled to detect any obvious mistakes in entering the filing number, registration number, and CNR number. For example, if the registration number corre-
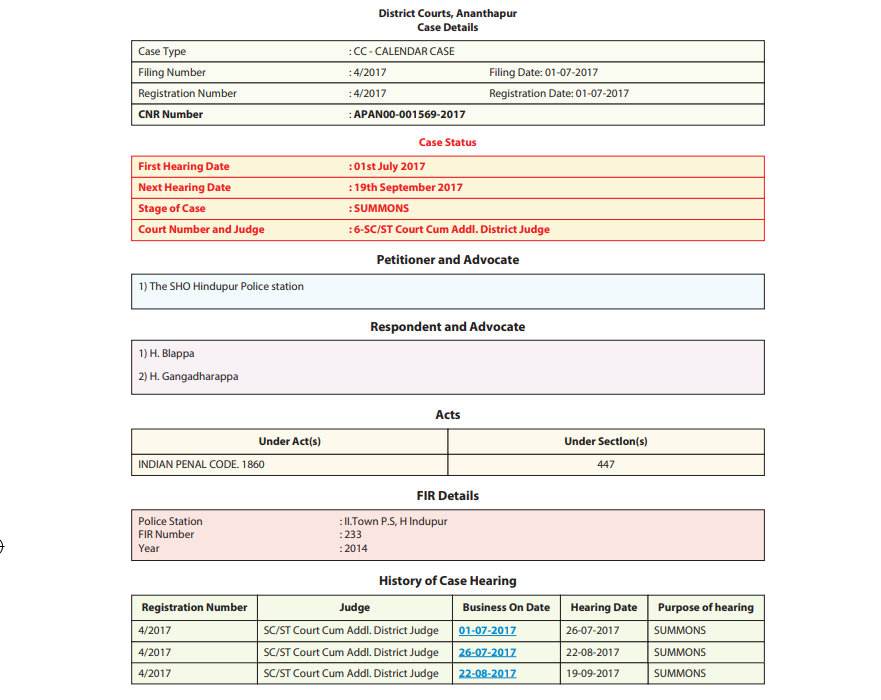
Figure 1: Case summary from the ecourts website 11
sponds to a date earlier than the filing number, it should raise a warning and ask for correction. Or, if the CNR number has segments that are obviously incorrect and can be detected, for instance in the state code, year and so on;
b. Case type: A major issue with the dataset is that of case types which are not standardised at all in the ecourts database. The Supreme Court has standard- isation a list of case types, and so have high courts in various jurisdictions. One of them must be followed while entering case types instead of arbitrary ones based on the preference of the data entry operator or ones that emerge from abbreviations. For this, this field can have an auto-complete feature with the overall dictionary being already populated in the backend, requir- ing the data entry operator to only choose from among the ones that show up once they start typing. Currently, in the absence of such a feature, any case type-wise analysis is fraught with inaccuracies;


c. Case act and section: Again, lack of standardisation leads to arbitrariness in this field as well. Using a logic similar to a) and b) above, this can also be standardised and the feature of auto-complete added to make it convenient for data entry. Again, similar to point b) above, in the absence of such a database, any analysis along these lines will be fraught with inaccuracies;
d. Litigant details: This is another field with a high chance for errors, so to the extent possible, full name and address (or even pincode / district) can be added. Further, adding the type of litigant (such as government, corporate, or individual, of course, a more careful and contextual list can be customised for the jurisdiction of each high court) can also be considered since it is likely to have a significant bearing on several other factors and interventions.
Having described the dataset that can be leveraged for analysis, the remaining sections of the chapter will discuss the variations observed with respect to the geography or jurisdiction (district/state) and litigant type. Moving further in the chapter, using such publicly available data, the OR models for efficient resource reallocation are presented along with possibilities for future research.
This analysis is based on an undergraduate thesis 13 on the theme of data-driven reforms in the law and justice system. It used large data sets downloaded from the ecourts website and extracted using OR/Data Science tools such as SQL and Python. The data relating to the districts was downloaded and analysis was per- formed to profile the states on their case disposal (duration) times as well as detect anomalies 14 to generate insights for peer learning. Of course, the analysis can also serve the purpose of sheer monitoring of the progress of district courts across the country, and take corrective measures if and where warranted by the key decision makers.
It also included clustering analysis 15 to determine the dependence of case dura- tion on various attributes of the cases. A predictive model is also developed to estimate the time 16 for a case considering various attributes. However, for the purposes of this chapter, we restrict our attention to the profiling and anomaly detection bit.
The data of all districts wasn’t available to download when the analysis was performed. But that doesn’t affect the key message being attempted to be deliv- ered here, hence we present the findings. The courts were profiled on the basis of measures of case delays such as mean case duration times, and tail bounds such as the proportion of cases that take more than a given duration. For the purposes of this study, the values chosen for the duration are 3, 6, 12 and 36 months.
The results present useful insights. Consider the mean case durations. The detailed list of districts and states is irrelevant, so we present the results for a small set of 6 districts in Table 2. The districts are chosen such that they represent the entire spectrum of performance: serial numbers 1 and 2 represent what are among
Table 2: Mean case durations of selected districts
|
S.No |
State |
District |
Mean |
|
1 |
Sikkim |
West Sikkim |
28 days |
|
2 |
West Bengal |
Paschim Medinipur |
2 months 3 days |
|
3 |
Punjab |
Jalandhar |
5 months 27 days |
|
4 |
West Bengal |
Malda |
5 months 28 days |
|
5 |
Telangana |
Karimnagar |
1 year 3 months 21 days |
|
6 |
Jammu & Kashmir |
Kathua |
2 years 1 month 14 days |
the best districts across the country, 5 and 6 represent what are among the worst and 3 and 4 represent districts somewhere in between.
Thus there are 2 districts each that are top, bottom and average performers. Note that the values of the mean represent a snapshot, i.e., the case duration as on the date of downloads and would have changed now. However, that is immaterial to our analysis. Several interesting observations emerge:
Now, one can argue that means (averages) do not represent the full picture. What really matters is the performance of the “tail”, to borrow from statistics. That is, how are the worst cases, i.e., with the highest case durations doing across the districts. Table 3 presents some relevant data to address this concern. The results represent the percentage of cases with durations of more than 3, 6, 12, and 36 months. So, the higher the percentage, the worse the situation in terms of delays. Again, representations are taken from the entire spectrum. There is some consis- tency with Table 1 in the sense that Sikkim performs well even on this metric,
Table 3: Tail bounds for districts across the country
|
State |
District |
Percentage of cases taking more than |
|||
|
3 months (%) |
6 months (%) |
1 year (%) |
3 years (%) |
||
|
Overall Average |
|
60.2 |
47.9 |
31.1 |
6.3 |
|
Telangana |
Hyderabad |
89.7 |
80.0 |
61.7 |
16.2 |
|
Uttar Pradesh |
Barabanki |
77.8 |
76.3 |
71.9 |
4.8 |
|
Jammu & Kashmir |
Kathua |
82.9 |
72.9 |
58.5 |
25.2 |
|
Jammu & Kashmir |
Anantnag |
18.1 |
12.1 |
8.2 |
2.4 |
|
Sikkim |
South Sikkim |
14.4 |
8.0 |
3.3 |
0.1 |
|
Sikkim |
West Sikkim |
8.5 |
4.2 |
2.0 |
0 |
and Telangana has representation among the worst performers. However, there are no seeming anomalies of the same high court (state) hosting districts among both the toppers and the laggards. However, the key point of performance vary- ing significantly across districts in the country is still valid. And so is the action item of undertaking studies to dig deeper to explore relevant interventions for the exchange of best practices.
To summarise, the following implications emerge from our analysis that can be utilised for peer learning, exchange of best practices and further exploration of other methods, as indicated later in this chapter:
◆ Courts with jurisdiction in Uttar Pradesh (UP) and Madhya Pradesh (MP) states perform well overall with respect to the multiple metrics used in the study.
◆ Maharashtra and Telangana are two states, among the bigger ones, that need improvement on the metrics of this study. For example, Maharashtra districts have high case duration and tail bounds, and all but 2 districts lie in the bottom half of these metrics among all districts of the country.
◆ Sikkim is a star performer on these metrics, with 4 of its districts among the top 20. To what extent is this due to its small size, however, is a question that needs deeper investigation.
◆ Among large states, Bihar presents an interesting dichotomy: despite good performance overall in mean case duration, some districts have high tail bounds. This points to the fact that while there are a good number of well-performing districts, some have particularly large challenges. This needs further studies to understand and cull out any useful insights.
◆ Some States show high variation between districts: UP has at least 1 district in the top 20 from the point of view of mean case duration, and those are in the bottom half. Similarly, Karnataka has districts on both ends of the spectrum. All of this further buttresses one of our key points of the need and potential benefits of peer learning.
We conclude this section by making some important remarks. Case duration is not the only metric to determine well-performing states. They do not really account for judgement quality. However, it is a metric to consider for policymak- ers, and the results should only be taken in that spirit. Further, the analysis and interpretations are not intended to be conclusive. They only point to directions and potentialities that need to be further explored before any policy or executive changes are made.
This section investigates the relationship between types of litigants and the mean case duration. It is based on the work done during an undergraduate thesis sub- mitted at IIT Delhi 17 . The fundamental premise underlying this work is to analyse if the type of litigants has any bearing on the case durations, and the findings do reveal interesting insights. The overall methodology is as follows:
i. Extract the litigant type from the case summary shared in Figure 1 using Python as shared in section 2,
ii. Place them in one of the 5 classes:
◆ Government (G),
◆ Private sector entities Domestic (PD),
◆ Private Entities International (PE),
◆ Non-profit entities (NP), and
◆ others,
iii. compute the mean case duration of each case in each category, and
iv. Through hypothesis testing using ANOVA and Mann-Whitney U Test, infer whether the case duration varies across these classes and whether dif- ferences, if any, are also influenced by geographical regions.
The classification into classes using the litigant information as shared in Figure 1 is done using the following categorisation:
a. Government ( G ): includes Police, Public Sector Undertakings (PSUs), Central, State and Local governments through keywords such as state, pros- ecutor, police, PS (Police Station) and officer ;
b. Private Domestic ( PD ): Publicly and Privately held companies through keywords of the type corporation, ltd, m/s, Messrs, partnership, firm and enterprise ;
c. Private International ( PI ): through keywords such as LLC, LLP and Inc ;
d. Non-Profit Entities ( NP ): through keywords that include Societies and Trusts .
Further, the categorisation is either based on string matching or basic Natural Language Processing (NLP) methods such as word2vec . The analysis reveals that differences in mean case duration across litigant types are statistically significant, and it also depends on whether the litigant type is a responder or a petitioner in the case. Further, the case disposal time also depends on the region where the case is filed. For instance, the duration for a PD or NP litigant is likely to be more than that of a G litigant. Similarly, the duration for a litigant in the other category is likely to be greater than both G and PD . These findings can be studied further to determine whether the difference is due to the resources that can be mustered by the litigant, due to the relevant acts, or just sheer judicial procedure correspond- ing to them. In any case, the action item still is to identify best practices, if any, and explore other data-based solutions, an example of one of which is presented in the next section.
The underlying idea being explored in this section is whether reallocation of resources and redistributing them within the given constraints can improve the system’s performance.
A detailed mixed integer linear programming model 18,19 is developed along with an optimisation formulation 20 to identify the required number of judges (optimal) for the respective districts and courts to maximise the number of cases disposed. The model works in two stages, with the following five constraints in the first stage:
i. The disposal of cases for each type cannot exceed the sum of pending and instituted cases for a particular year,
ii. The disposal of cases for each case type is at least a given proportion (Clear- ance rate. of the instituted cases and cases are picked irrespective of the high or low rates of disposal,
iii. The number of judges across the districts of each category must be equal to the number of judges of the same category,
iv. The total number of judges across the districts must not exceed the permit- ted number of judges,
v. Every district should have at least one judge for the respective category.
In the second stage, more constraints are added to identify the possible disposals of all case types:
i. Possibility of the judge transfer is verified and checked with the obtained values,
ii. The number of recruits cannot be more than the difference between the required and initial judges, and recruitment takes place when the judge number is more than the initial judges,
iii. Recruitments cannot exceed the sanctioned recruitments in the considered judge category,
iv. New judges are not added if there is a surplus and cannot leave if there is a deficiency,
v. Identify the balance of the flow of judges from each category of district and judge,
vi. No surplus judges in any category of a district,
vii. Ensuring an overall balance for the judges across the districts,
viii. Transfer of judge is only in one direction i.e., if one judge is out, there is no coming in of another judge in the same district,
ix. The transfer of the number of judges in each district is not more than the surplus or deficit,
x. The number of disposals in each district for each case type is not more than the sum of instituted cases and the ratio of cases pending and time to dis- pose of them.
The annual data of the cases disposed of in the courts with a minimum number of judges is collected from the National Judicial Data Grid (NJDG)21. Considering the real-time data of the courts, an analysis is conducted to improve the case disposals through optimal reallocation of judges to the courts thus potentially improving justice delivery. Table 4 provides information on the current judge strengths from eleven district courts in Delhi, India. The model attempts to deter- mine whether optimal reallocation decisions in the district and session courts can improve performance. The analysis is performed on the 2020 data to avoid the effects of the pandemic.
The objective is to determine the optimal number of judges required for each court under different categories. It is assumed that both transfers within districts and recruitments are possible to achieve the optimal requirements. The results for the model run under various scenarios are presented in Table 5. Scenario 1 rep- resents the “no-recruitments”, and scenarios 2 through 4 represent recruitments while still remaining within the sanctioned strength.
Two key points emerge:
◆ Even without any new recruitments, merely by transferring judges within districts, an improvement in the number of cases disposed is possible. At a strength of 668, well within the sanctioned strength noted in the Indian Judiciary Annual Report 2018-19 published by the Supreme Court of India, the optimal clearance rate starts touching 1.0, and then there is incremental improvement beyond that as well,
◆ Further, this is an ongoing project at the DAKSH Centre of Excellence for Law and Technology at IIT Delhi and needs more information and inves- tigation for implementable findings, but points to potential improvements assuming that the snapshot (in terms of case disposal rate) represented by the current numbers can be extended to the situation where the number of judges changes across case types and districts. Thus, taking a cue from the analysis presented in the previous two sections, since not all categories of cases share the same performance and case inputs, balancing the caseload among them can lead to possible improvements.
Table 4: Number of judges in various courts of Delhi before optimisation
|
Judge category/ district |
Central |
East |
New Delhi |
North |
North-East |
North-west |
Shahadara |
South |
South-East |
Sout-west |
West |
Total |
|
Family |
2 |
2 |
1 |
2 |
2 |
2 |
2 |
1 |
2 |
2 |
3 |
21 |
|
MACT |
2 |
1 |
1 |
2 |
1 |
1 |
1 |
1 |
1 |
1 |
2 |
14 |
|
Civil |
71 |
20 |
24 |
20 |
11 |
21 |
18 |
26 |
30 |
32 |
36 |
133 |
|
Criminal |
33 |
8 |
11 |
8 |
5 |
9 |
7 |
10 |
14 |
10 |
18 |
309 |
|
Total |
108 |
31 |
37 |
32 |
19 |
33 |
28 |
38 |
47 |
45 |
59 |
477 |
Table 5: Optimal solution for the scenario with transfers within the districts
|
Scenario |
Maximum strength |
% increase in the strength |
Disposals (optimal) |
Improvement in disposal |
Optimal clearance rate |
|
1 |
477 |
0 |
476832 |
6399 |
0.78 |
|
2 |
573 |
20 |
564930 |
94497 |
0.92 |
|
3 |
668 |
40 |
609054 |
138621 |
0.99 |
|
4 |
764 |
60 |
611990 |
141557 |
1.00 |
The details in this chapter provide the researchers with an insight into the differ- ences in judicial performance across various categories and its implications as well as a possible way to leverage that through an investigation into judicial resources. Although the findings indicate that potential benefits are using OR methods in response to the picture painted by these datasets, there is a large scope for further investigation into the datasets and models developed here. Accordingly, further studies can consider the following dimensions: legal types that involve acts, case proceedings, and other factors relevant to the case flow process or the overall effi- ciency of the judicial process. Subsequently, any implementation mechanism once the findings are vetted and found relevant, will necessarily be the key stakeholders of the judicial system.
|
Editors’ Comments Next, this part of the volume ends with a discussion of some hacks of statistics: All analytics depends on data processing and analysis. Accordingly, a chapter to highlight some key and fundamental concepts while dealing with data is in order. The next chapter serves this purpose by bringing forth the pitfalls that must be avoided while leveraging data for decision-making. |
References